


For Teams Scaling Fast Without Scaling Costs
Observability costs have a scaling problem. At 5TB/month, most APM tools are affordable. At 30TB, the differences become budget-defining. At 100TB, the wrong choice costs more than several engineers’ annual salaries. The tools that looked comparable during a proof-of-concept can diverge by 6-12x once production data volumes hit the pricing model’s pressure points.
For fast-growing engineering teams – the ones adding services, hosts, and data volume every quarter – the APM pricing model matters more than the sticker price. A flat per-GB model scales linearly. A multi-dimensional model (hosts + metrics + indexing + users) can compound in ways that are hard to predict during evaluation and harder to control once you’re committed.
This guide looks at seven APM platforms from the perspective of what happens to the bill as you grow – not just what it costs today, but how the pricing model behaves at 2x and 5x your current scale.
Cost estimates use a 30TB/month reference scenario: 100 hosts, 20 users, 500K metric series, 30-day retention. Full methodology at the end of this article.
How APM Costs Actually Scale
Not all pricing models scale the same way. Here’s what matters as your infrastructure grows:
- Linear scaling (predictable): Flat per-GB pricing. Double the data, double the cost. Easy to budget, easy to forecast. Self-hosted platforms typically fall here.
- Multi-dimensional scaling (unpredictable): Per-host + per-metric + per-indexing event + per-user. Each dimension scales independently, and they compound. A team that doubles host count and triples custom metrics doesn’t see a 2-3x bill – it can be 4-6x.
- Cliff pricing: Some costs are hidden until you cross a threshold – log indexing volumes, custom metrics beyond allotment, retention upgrades, user tier bumps. These cliffs are hard to anticipate during evaluation.
- Commitment-based: Annual contracts with minimum commitments. Good for discounts, bad for fast-growing teams whose usage patterns change quarter to quarter.
The tool summaries below focus on how each pricing model behaves under growth pressure.
1. CubeAPM
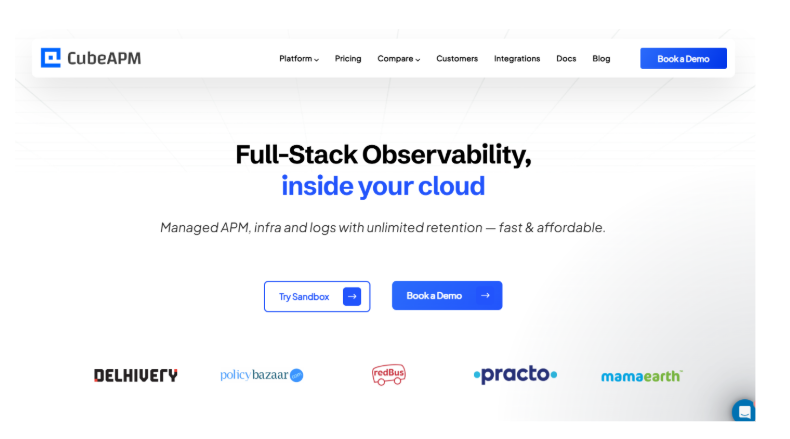
Scaling profile: Linear. Costs scale directly with data volume – nothing else.
Overview
CubeAPM is a self-hosted, OpenTelemetry-native observability platform covering APM, logs, infrastructure, Kubernetes, RUM, synthetic monitoring, Kafka monitoring, and error tracking. Single billing dimension: $0.15/GB ingested. No per-host, per-seat, or custom metrics fees.
Recognized as a High Performer in G2’s Spring 2026 APM Grid Report. Used by redBus (world’s largest bus aggregator), Delhivery ($3.5B valuation), Mamaearth ($1.2B valuation), Policybazaar, Practo, Ola, and others.
How It Scales
At 30TB/month: ~$5,100/month all-in
At 60TB/month: ~$10,200/month all-in
At 100TB/month: ~$16,500/month all-in
Perfectly linear. Double the data, double the cost. No host fees mean adding 100 more servers doesn’t change the bill unless they generate more telemetry. No custom metrics surcharge means adopting OpenTelemetry doesn’t trigger hidden costs. No user fees mean the whole team has access without per-seat budgeting.
Delhivery documented 75% savings. Mamaearth documented ~70% savings and migrated in under an hour. redBus reported 4x faster dashboards and 50% faster MTTR. Multiple customers run at petabyte-scale monthly ingestion.
Key Features
- Consistently 70–75% lower cost than enterprise APM at scale
- Full-stack unified monitoring – APM, logs, infra, Kubernetes, Kafka, RUM, synthetics, error tracking
- Data residency & Enterprise compliance: CubeAPM’s self-hosted architecture ensures full data residency control by design, while SOC 2 and ISO 27001 certification demonstrate adherence to industry-recognized security and governance standards.
- OTel-native from day one – no proprietary agents
- Multi-agent compatible – works with OTel, Datadog, New Relic, Elastic, Prometheus agents for incremental migration
- Self-hosted/BYOC – data sovereignty by architecture
- AI-based Smart Sampling, unlimited retention, predictable pricing
- Direct engineering support via shared channels
Pros
- Most predictable cost scaling in this list – one dimension, linear growth
- 70-75% cheaper than enterprise APM at every scale point
- No billing cliffs – what you see is what you pay
- Self-hosted means no SaaS dependency
Cons
- Requires BYOC or on-prem deployment comfort
- No autonomous anomaly detection
- SSO/RBAC less mature than enterprise SaaS incumbents
2. Datadog
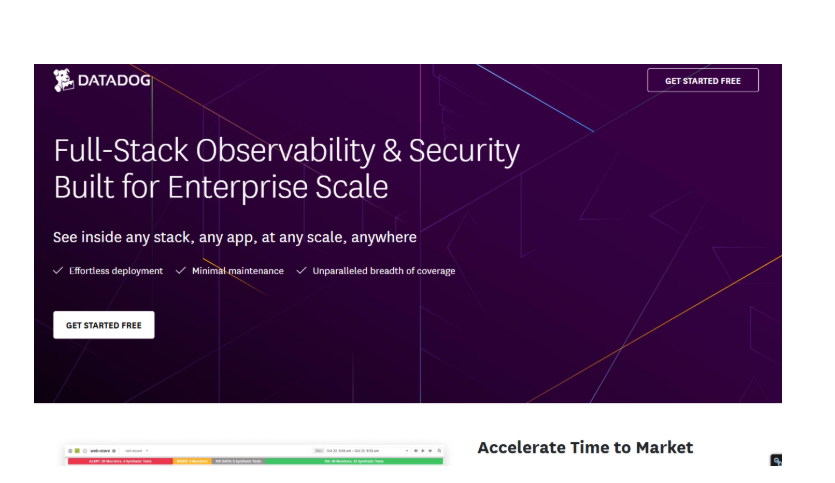
Scaling profile: Multi-dimensional. Costs compound across hosts, metrics, indexing, users, and features.
Overview
Datadog is the category leader with 700+ integrations and the broadest ecosystem. The pricing model has more independent dimensions than any other tool in this list, which means cost forecasting requires modeling each dimension separately.
How It Scales
At 30TB/month: ~$30,000-$45,000+/month
Scaling pressure points: hosts scale linearly (~$24/host/month), but custom metrics can scale super-linearly as teams add services and OTel instrumentation. Log indexing at $2.50/million events is the dominant cost driver – doubling log volume with the same indexing percentage doubles this cost. Teams often discover the custom metrics dimension only after committing, when OTel metrics are reclassified and billed at $5 per 100/month.
Third-party calculators exist for modeling these costs – essential before committing to an annual contract.
Key Features
- Unified observability: metrics, logs, APM, RUM, synthetics, security
- 700+ integrations, Watchdog AI
- Service maps, deployment tracking, CI/CD correlation
Pros
- Best integration ecosystem and UI polish
- Watchdog AI reduces alert noise at scale
- Strong deployment tracking
Cons
- Most complex pricing model – multiple dimensions compound unpredictably as you grow
- Custom metrics surcharge penalizes OTel adoption and service proliferation
- No self-hosted option; data leaves infrastructure (for teams where this is a constraint, self-hosted platforms like CubeAPM offer linear scaling with full data control)
- Retention costs add a further dimension at scale
3. Dynatrace
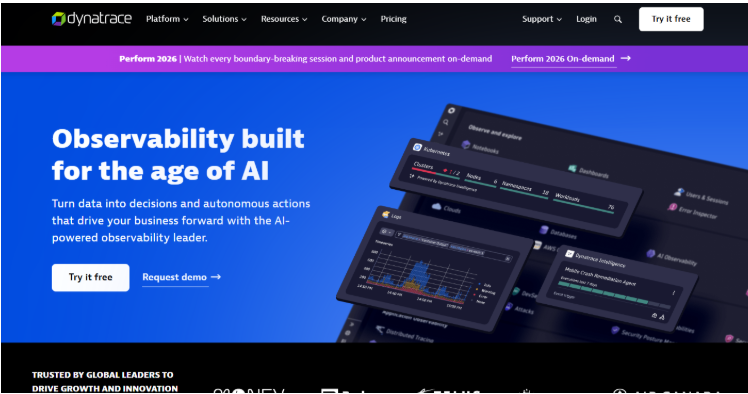
Scaling profile: Consumption-based with annual floor. Costs grow with usage, but the annual commitment creates a minimum.
Overview
Dynatrace’s Davis AI for causal root cause analysis is the primary differentiator. Consumption-based pricing through DPS gives some usage flexibility, but the annual minimum commitment means fast-growing teams may outgrow their initial contract parameters.
How It Scales
At 30TB/month: ~$20,000-$35,000+/month
Scaling pressure points: host-based monitoring at $0.08/hour per 8 GiB scales with infrastructure growth. The 4 GiB minimum billing means teams running many small containers pay disproportionately. Annual commitment means you’re locked to projected usage – fast growth beyond projections triggers mid-contract renegotiation.
Key Features
- Davis AI: causal root cause analysis
- Automatic service discovery, Smartscape topology
- Full-stack monitoring, Dynatrace Managed for self-hosted
Pros
- Best automated root cause analysis
- Genuine self-hosted option via Dynatrace Managed
- Automatic topology discovery reduces setup effort
Cons
- Annual commitment makes fast-scaling teams vulnerable to contract misalignment
- 4 GiB minimum billing penalizes container-heavy architectures
- Proprietary OneAgent adds an agent management burden
- Davis AI requires baselining period before full effectiveness
4. New Relic
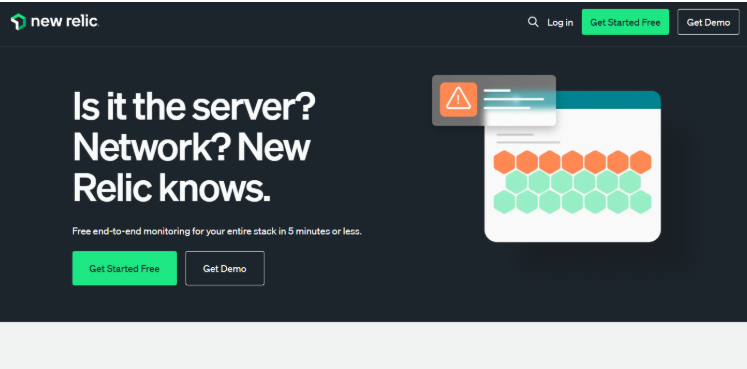
Scaling profile: Dual-axis. Data and user count scale independently – both grow with the team.
Overview
New Relic’s NRDB unified telemetry store and NRQL make it accessible, and the 100GB free tier is the easiest starting point. But the dual pricing axes – data ingest plus user fees – mean that growing your data volume and growing your team each independently increase the bill.
How It Scales
At 30TB/month: ~$20,000-$25,000+/month
Scaling pressure points: data ingest at $0.40/GB is straightforward, but adding 90-day retention bumps this to $0.60/GB – a 50% increase that often happens post-adoption. User fees ($99-$349/user/month for Full Platform) mean every engineer you add to the observability workflow increases the bill. For fast-growing teams hiring rapidly, this second axis compounds.
Key Features
- NRDB: unified telemetry store,
- NRQL: flexible querying
- Free tier: 100 GB/month + 1 user
- Compute-based pricing option to cap user costs
Pros
- Best free tier for getting started
- NRQL is excellent for ad-hoc analysis
- Compute pricing option available for large teams
Cons
- Dual cost axes mean data growth and team growth both escalate costs
- 8-day default retention – extending to 30 or 90 days is a significant cost jump
- No self-hosted option
- Per-user pricing discourages broad team access to observability
5. Grafana Cloud (LGTM Stack)
Scaling profile: Usage-based with self-hosted escape hatch. Managed costs scale with volume; self-hosted trades money for SRE time.
Overview
Grafana Cloud’s LGTM stack is OTel-native with no custom metrics penalty. The self-hosted option is free, making it unique as the only platform where you can eliminate licensing costs entirely if you have the SRE capacity. Managed costs are competitive at moderate scale but approach enterprise SaaS territory at high log volumes.
How It Scales
At 30TB/month (managed): ~$15,000-$20,000+/month
Scaling pressure points: log costs at ~$0.55/GB effective are the primary driver. Adaptive Metrics and Adaptive Logs features can reduce costs materially, but effectiveness varies by workload. The self-hosted path is free in licensing but demands SRE investment that scales with data volume. At 30TB+, expect a dedicated team to manage Loki, Tempo, and Mimir.
Key Features
- LGTM stack: Loki, Grafana, Tempo, Mimir
- OTel-native, no custom metrics penalty
- Adaptive Metrics/Logs for cost reduction
- Self-hosted (free) or managed cloud
Pros
- OTel-native with no proprietary lock-in
- Self-hosted path eliminates licensing cost entirely
- Adaptive features proactively reduce bills
Cons
- Self-hosting at scale is an operational investment, not a free lunch
- Managed costs approach Datadog/New Relic territory at high volume
- No built-in AI/ML anomaly detection
- APM less mature than purpose-built tools
6. Elastic APM
Scaling profile: Deployment-based. Costs are driven by Elasticsearch cluster sizing, not ingestion metering.
Overview
Elastic APM is the most cost-effective option for teams already running Elasticsearch for log management. The incremental cost of adding APM traces to an existing cluster can approach zero. For teams without Elastic, the infrastructure investment to run Elasticsearch at 30TB is significant.
How It Scales
At 30TB/month (Elastic Cloud): ~$8,000-$15,000/month
Scaling: deployment-based pricing means costs are driven by cluster size (compute, storage tiers, replicas), not directly by ingestion volume. This can be advantageous – efficient data lifecycle management (hot/warm/cold tiers) can keep costs sub-linear relative to data growth.
Key Features
- Native Elasticsearch integration for log + trace correlation
- OTel compatible, ML anomaly detection
- Self-hosted (free) or Elastic Cloud
Pros
- Near-zero incremental cost for existing ELK deployments
- Storage tiering allows sub-linear cost scaling
- Self-hosted keeps data on your infrastructure
Cons
- New Elasticsearch deployments at 30TB require significant investment
- APM UX less polished than purpose-built tools
- SSPL licensing change requires compliance review
- Self-hosted support limited to paid subscriptions
7. Splunk Observability Cloud
Scaling profile: Enterprise contract. Costs are the highest at any scale point.
Overview
Splunk Observability Cloud offers full-fidelity tracing and deep SIEM integration. For organizations with existing Splunk investments, the observability cloud extends the platform. For everyone else, the cost premium is significant and grows with scale.
How It Scales
At 30TB/month: ~$35,000-$60,000+/month
This is the most expensive option at every scale point in this guide. The value proposition is exclusively for organizations that have substantial existing Splunk infrastructure and need unified security + observability. For cost-conscious scaling teams, the math doesn’t work.
Key Features
- Full-fidelity distributed tracing (no sampling)
- AI alerting, deep Splunk SIEM integration
- Real-time stream processing
Pros
- Full-fidelity traces – no blind spots
- Best security + observability integration
- AI alerting with noise reduction
Cons
- Most expensive option at every scale point
- Value only for existing Splunk organizations
- Significant vendor lock-in
- Deployment complexity
Cost Comparison at 30TB/Month Ingestion
| Tool | Est. Cost @ 30TB/mo | Pricing Model | OTel Native | Data Residency | Self-Hosted |
|---|---|---|---|---|---|
| CubeAPM | ~$5,100/mo all-in($4,500 license +$600 infra) | $0.15/GB flat | ✓ Native | ✓ Always | ✓ Yes |
| Elastic APM | ~$8K-$15K (cloud) | Deployment-based | ✓ Partial | ✓ If self-hosted | ✓ Yes |
| Grafana Cloud | ~$15K-$20K+ | Usage-based | ✓ Native | ✓ If self-hosted | ✓ Yes |
| New Relic | ~$20K-$25K+ | Ingest + per-user | Partial | ✗ SaaS only | ✗ No |
| Dynatrace | ~$20K-$35K+ | GiB-hour + commit | Partial | ✓ Managed option | ✓ Managed |
| Datadog | ~$30K-$45K+ | Host + feature-based | Partial* | ✗ SaaS only | ✗ No |
| Splunk | ~$35K-$60K+ | Host + enterprise | Partial | Limited | Limited |
* OTel metrics in Datadog are often billed as custom metrics. All estimates use the reference scenario. Vendor discounts can significantly reduce SaaS costs.
How to Choose for Your Growth Trajectory
Choose CubeAPM if you need costs to scale linearly and predictably. At every scale point from 10TB to 100TB+, the single-dimension pricing ($0.15/GB) is the easiest to forecast and the lowest in this list.
Choose Datadog if integration breadth justifies the premium and your team can model the multi-dimensional cost at 2-3x your current scale before committing.
Choose Dynatrace if automated root cause analysis is the priority and your growth trajectory is predictable enough for an annual commitment.
Choose New Relic if you’re starting small and the free tier matters. Plan for the retention upgrade cost and per-user fees as the team grows.
Choose Grafana Cloud if you have the SRE capacity to self-host and want to eliminate licensing costs, or if managed cloud pricing is competitive at your volume.
Choose Elastic APM if you already run ELK. The incremental cost is near zero – the most capital-efficient option for existing Elastic shops.
Choose Splunk only if your organization already has substantial Splunk infrastructure and the security integration justifies the highest price in the market.
Final Thoughts
APM pricing is a growth-stage decision, not a point-in-time comparison. The tool that looks affordable at 5TB can be unaffordable at 50TB if the pricing model has hidden compounding dimensions.
For fast-scaling teams, the most important question isn’t ‘what does it cost today?’ but ‘how does the cost behave as we double and double again?’ Flat per-GB models answer that question simply. Multi-dimensional models require spreadsheet modeling and annual contract renegotiation. Self-hosted alternatives have proven that full-stack observability at enterprise scale doesn’t have to cost 6-12x more than it should.
The advice is straightforward: model your costs at 3x your current volume across at least two vendors before committing. If the numbers diverge dramatically, you have your answer.
